Take note of this date: May 11. By then, if the math is right, the physical price of U.S. crude should be back in negative territory—though I have a hunch it will happen earlier.
As everyone still probably has vivid memories of last week, the collapse of West Texas Intermediate futures to sub-zero levels came after the physical market first slumped to such hitherto unseen prices.
As of April 14, the physical price of WTI was already at $16 per barrel when futures for May were trading as high as $23. On April 17—five days before expiration—the May contract was still hitting daily highs above $20, while the physical price had already slid to $14.25.
Of course, over the course of the next 72 hours, everything the U.S. crude market had become known for, as a global benchmark of oil since the early 1980s, disintegrated.
Oil’s “Black Monday” Set For Rerun
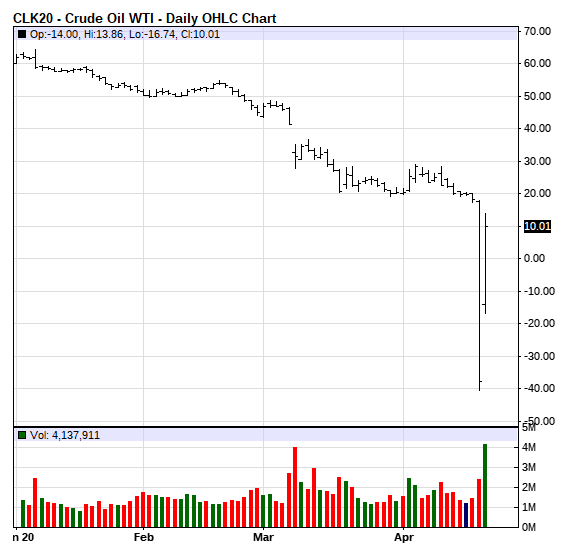
On oil’s “Black Monday,” April 20—the stock market has multiple iterations of black days and it was about time oil got one—May WTI raced down the abyss, matching the physical market’s quote dollar-for-dollar, to minus $40 at one point.

Freefalling May WTI plunged 440% at one juncture, as those stuck with the worthless expiring contract couldn’t find a single buyer in a pandemic-annihilated market. However, after its April 20 settlement of minus $37, May WTI was finally at home with its physical avatar, and laid to rest two days later at under $14.
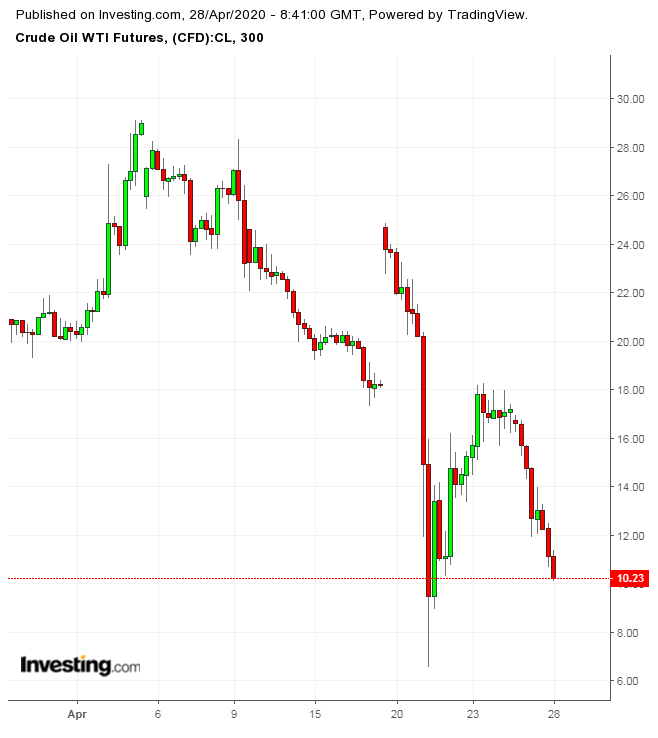
Now fast forward to this week: June WTI, U.S. crude’s new embodiment, suffered another jaw dropping 25% on Monday, though in dollar terms, it was only just over $4—to settle at $12.78. By Tuesday afternoon in Asia (0400 GMT), June WTI was down another 14%, or nearly $2, to a session low of $10.66.
And it could fall at least another $2 over the next 24 hours. Why?
Physical Market Driving Futures Lower
Because the physical market for WTI was already as low as $8.50 by Monday’s close. And it gets more interesting when you look at the math to see where it could go from here.

From its April 14 price of $16, physical WTI has lost almost $8 or 50% over the course of just two weeks. At this rate of attrition, June WTI could get to negative in two weeks—which would roughly be on May 11, or about a week before its May 19 expiration. The likelihood of it happening within the next few days is, of course, just as great.
If what happened to May WTI is any guide, then the replay of sub-zero pricing, with June in the driver’s seat, could be worse. The question, of course, is how much worse.
Minus $100 WTI This Time?
Mizuho oil analyst Paul Sankey thinks it could be in the three-digits as fear grows by the day that U.S. crude will run out of storage space soon. “Will we hit -$100/bbl next month?” Sankey asked in a note last week, then answered the question himself, saying, “quite possibly.” He added:
“The physical reality of oil is that it is difficult to handle, volatile, potentially polluting, and actually useless without a refinery.”
There are very few analysts out there, including those who’ve lived a life of looking at oil in a positive way, that will argue against June WTI going to zero or below. Proof of it is the lightning defections made to July WTI by investors who would typically be in the front-month contract, if only not for the demand loss of some 20 million to 30 million barrels per day versus production cuts at less than half of those levels.
Make no mistakes about it, volume in June is definitely higher than July by about 200,000 lots, or 200 million barrels. But open interest in the front-month—the key indicator of liquidity—was lagging the nearby contract by almost 55,000 lots or 55 million barrels.
June WTI’s open interest as a whole has dropped 255,000 lots or 255 million barrels over the past week.
Hedge Fund-Like USO Adds To Spot WTI’s Pain
And most tellingly, June WTI was at a discount of $7 per barrel to July—not the super contango of last week, but that could still happen with another three weeks to its expiration.
The liquidity ruin in June WTI was hastened, of course, by the United States Oil Fund (NYSE:USO), which unexpectedly moved to sell all its holdings in the most active U.S. crude futures contract so that it could spread its risk further down the calendar to June 2021.
USO said its move, which significantly widened WTI's June-July spread, was due to new limits imposed upon it by regulators and its broker.
Yet it was quite ironic to see an exchange-traded fund, whose original purpose was to mirror WTI’s front-month, now dictating its direction—somewhat like a hedge fund.
