- All Instrument Types
- Indices
- Equities
- ETFs
- Funds
- Commodities
- Currencies
- Crypto
- Bonds
- Certificates
Please try another search

Is the Broader Market Starting to Catch Up to the Magnificent 7?

- Apprehensions about the narrow market breadth have fueled pessimism among investors
- Meanwhile, 1,200 stocks have registered double-digit growth this year apart from the magnificent 7
- With historical seasonal trends favoring the bulls, will we see the broader market finally catch up with the magnificent 7?
- Know when to buy or sell - be the first to know with InvestingPro at 55% off this Black Friday!
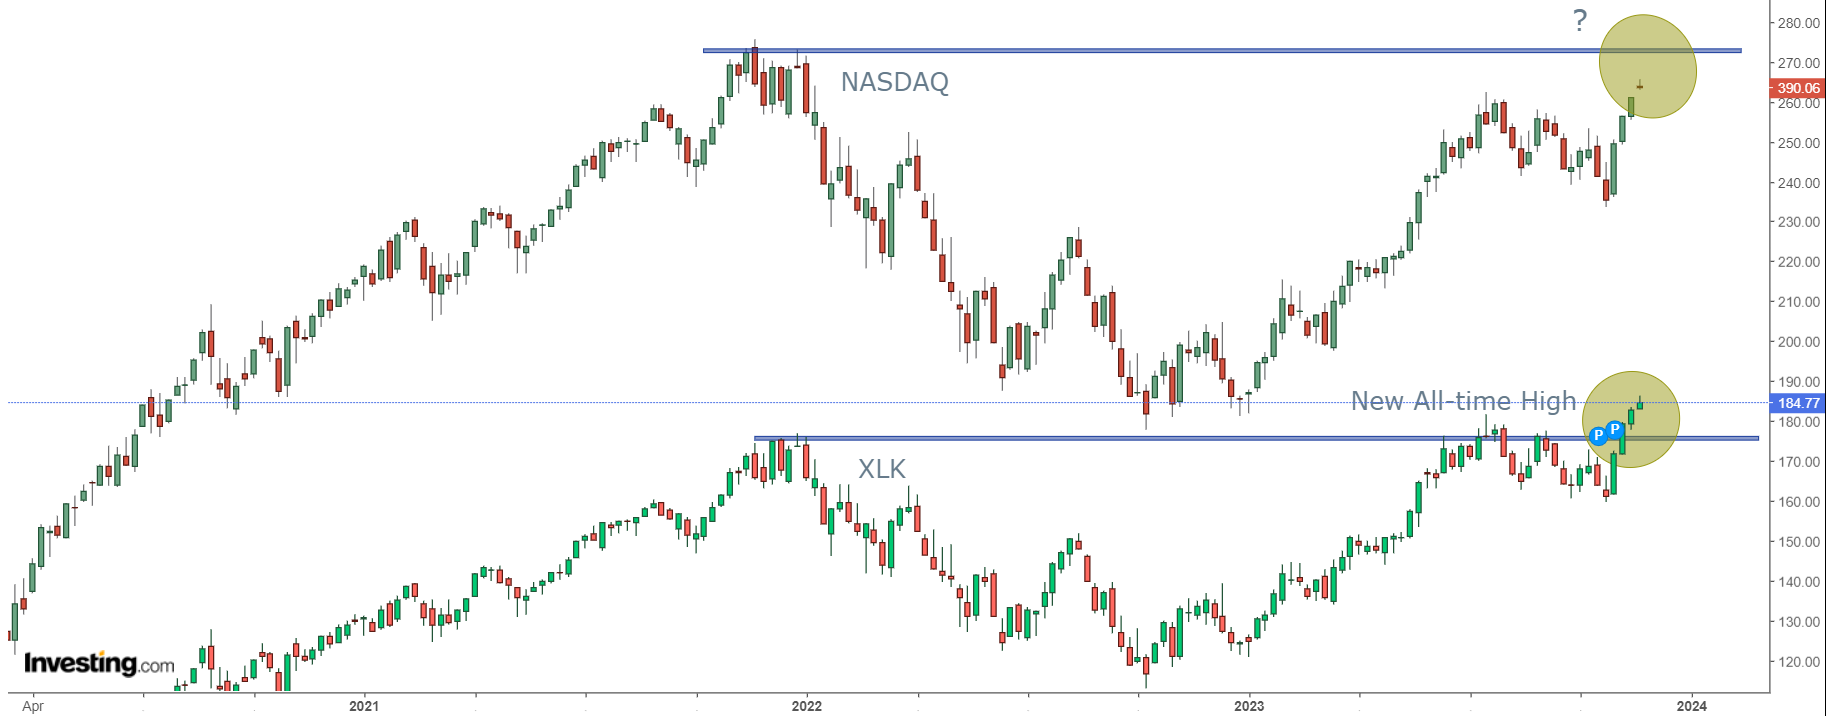
Recently, the Tech sector (NYSE:XLK) achieved a new all-time high. Specifically, half the stocks listed on Nasdaq reached this milestone alongside one-third of those listed on S&P 500.
Notably, 1,200 stocks on the NYSE have experienced double-digit growth this year. However, the discussion often tends to center around the ascent of the magnificent 7.
Broader Market Set to Follow the Tech Sector ETF in the Coming Months?
We are in the midst of a bull market, and these facts about the market breadth seem to be attracting little attention.
Over the past year, individuals have seemingly devoted more time to a pessimistic outlook rather than considering the market in its entirety.
However, looking forward, predicting what will unfold remains uncertain. Yet, historically, the period from November to January is viewed as the most bullish quarter of the entire year.
Additionally, it marks the commencement of the most bullish six-month period annually.
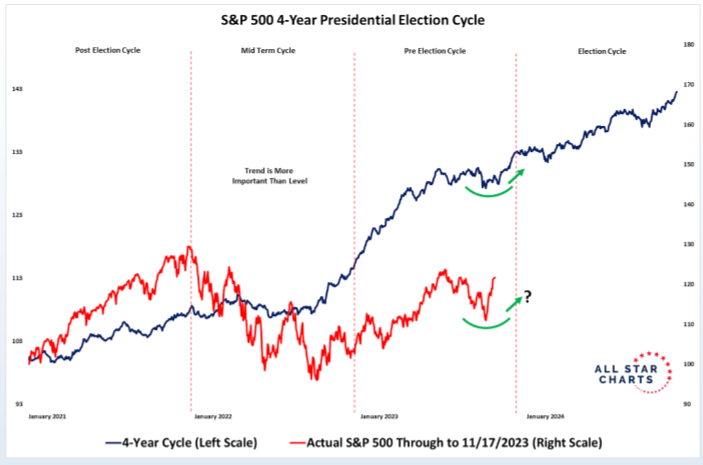
Examining the 4-year cycle of the S&P 500 and comparing it to the current year, a historical pattern emerges: we are currently at the exact point when stocks traditionally continue their uptrend.
Despite this historical trend, what remains noteworthy is the pessimism among investors, especially about the market breadth that seems too narrow.
Should You Wait on the Sidelines for a Sector Rotation Into Value Stocks?
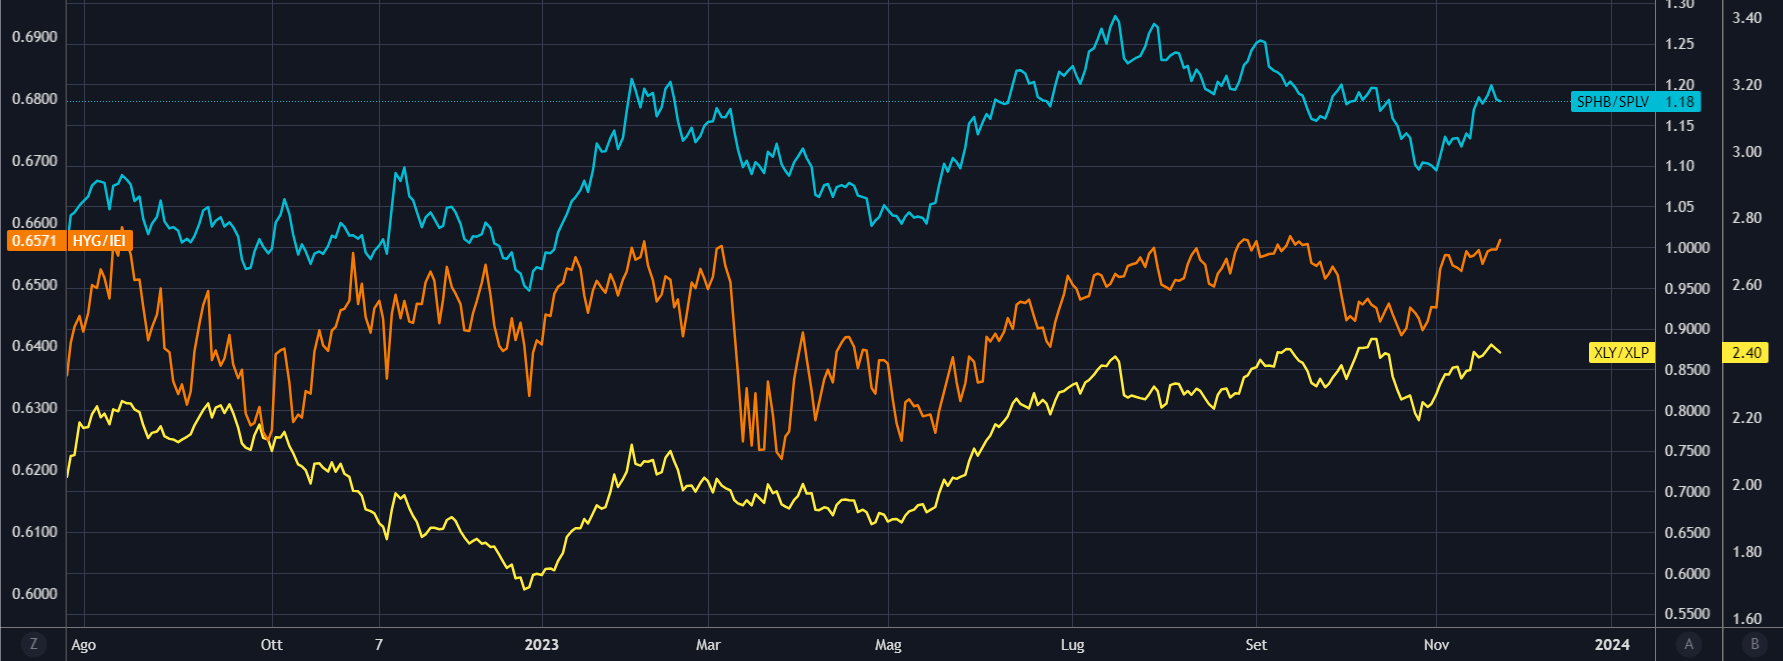
During times of fear and volatility, stocks belonging to unstable and struggling companies are often the first to be offloaded by investors. A glance at the chart indicates that we are still in a congestion phase.
Remarkably, High-beta stocks continue to establish higher highs and higher lows, with the Consumer Discretionary sector (NYSE:XLY) consistently outperforming the Consumer Staples sector.
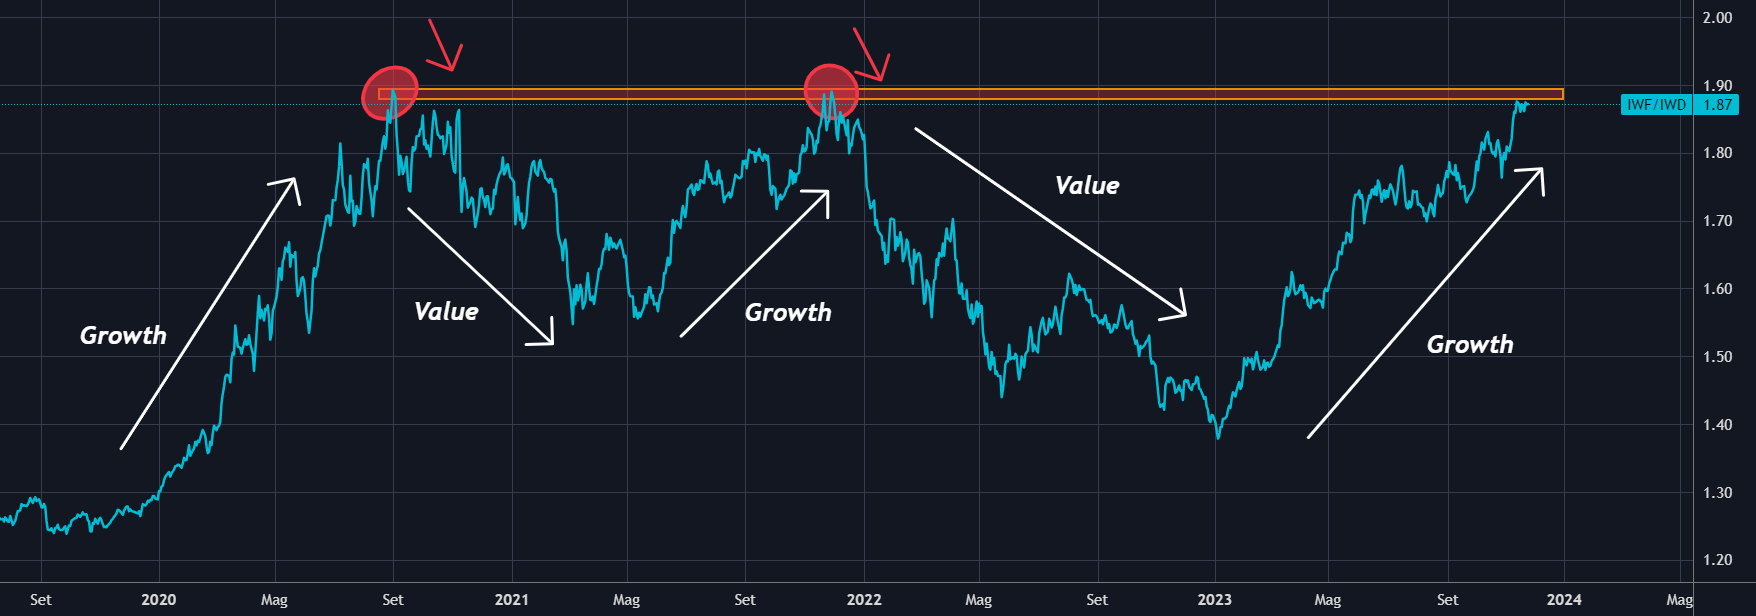
Many observers, analyzing the ratio below, anticipate a repeat of 2022 - a year in which the Value sector reclaimed prominence after more than a decade.
In fact, the iShares Russell 1000 Growth ETF (NYSE:IWF) has outperformed its Value counterpart, iShares Russell 1000 Value ETF (NYSE:IWD), by as much as 180%.
Over the past year, the Growth sector has consistently taken the lead, with the Growth/Value ratio now approaching its highs from September 2020.
The question arises: will it encounter the same challenges as the last two times when the ratio reaches these levels once again?
Certainly, we cannot disregard the potential psychological significance of this level in the ratio. The elevated highs carry a certain memory, and a shift in favor of Value would imply a reversal of trends, with other sectors taking on a leadership role.
Presently, the critical factor remains the dominance of Tech stocks. Ignoring this trend by waiting for declines may only keep us sidelined in the market.
***
Buy or Sell? Get the answer with InvestingPro for Half of the Price This Black Friday!
Timely insights and informed decisions are the keys to maximizing profit potential. This Black Friday, make the smartest investment decision in the market and save up to 55% on InvestingPro subscription plans.
Whether you're a seasoned trader or just starting your investment journey, this offer is designed to equip you with the wisdom needed for more intelligent and profitable trading.

Disclaimer: This article is written for informational purposes only; it does not constitute a solicitation, offer, advice, or recommendation to invest as such it is not intended to incentivize the purchase of assets in any way. I would like to remind you that any type of asset, is evaluated from multiple points of view and is highly risky and therefore, any investment decision and the associated risk remains with the investor.
Related Articles

There wasn't a whole pile of buying volume to go with gains, but the Nasdaq, S&P 500, and Russell 2000 (IWM) all did their bit to keep the nascent bounce going.It has the look...

Stocks rebounded last week with major US indexes closing in the green. But is this a sign of a turnaround, or a temporary blip before potential headwinds? A sharp drop in bullish...

Markets continue their downward momentum despite positive results from the first four Magnificent 7 reports Focus remains on big tech this week with all eyes on Amazon (AMZN)...
Are you sure you want to block %USER_NAME%?
By doing so, you and %USER_NAME% will not be able to see any of each other's Investing.com's posts.
%USER_NAME% was successfully added to your Block List
Since you’ve just unblocked this person, you must wait 48 hours before renewing the block.
I feel that this comment is:
Thank You!
Your report has been sent to our moderators for review


Add a Comment
We encourage you to use comments to engage with users, share your perspective and ask questions of authors and each other. However, in order to maintain the high level of discourse we’ve all come to value and expect, please keep the following criteria in mind:
Perpetrators of spam or abuse will be deleted from the site and prohibited from future registration at Investing.com’s discretion.