5 Charts to Understand the Fed's Liquidity Injection and Its Effect on Markets
Raoul Pal | Mar 27, 2023 17:00
In this week’s newsletter, we’re going to run through several interesting market charts on our radar...
Let’s dive right in.
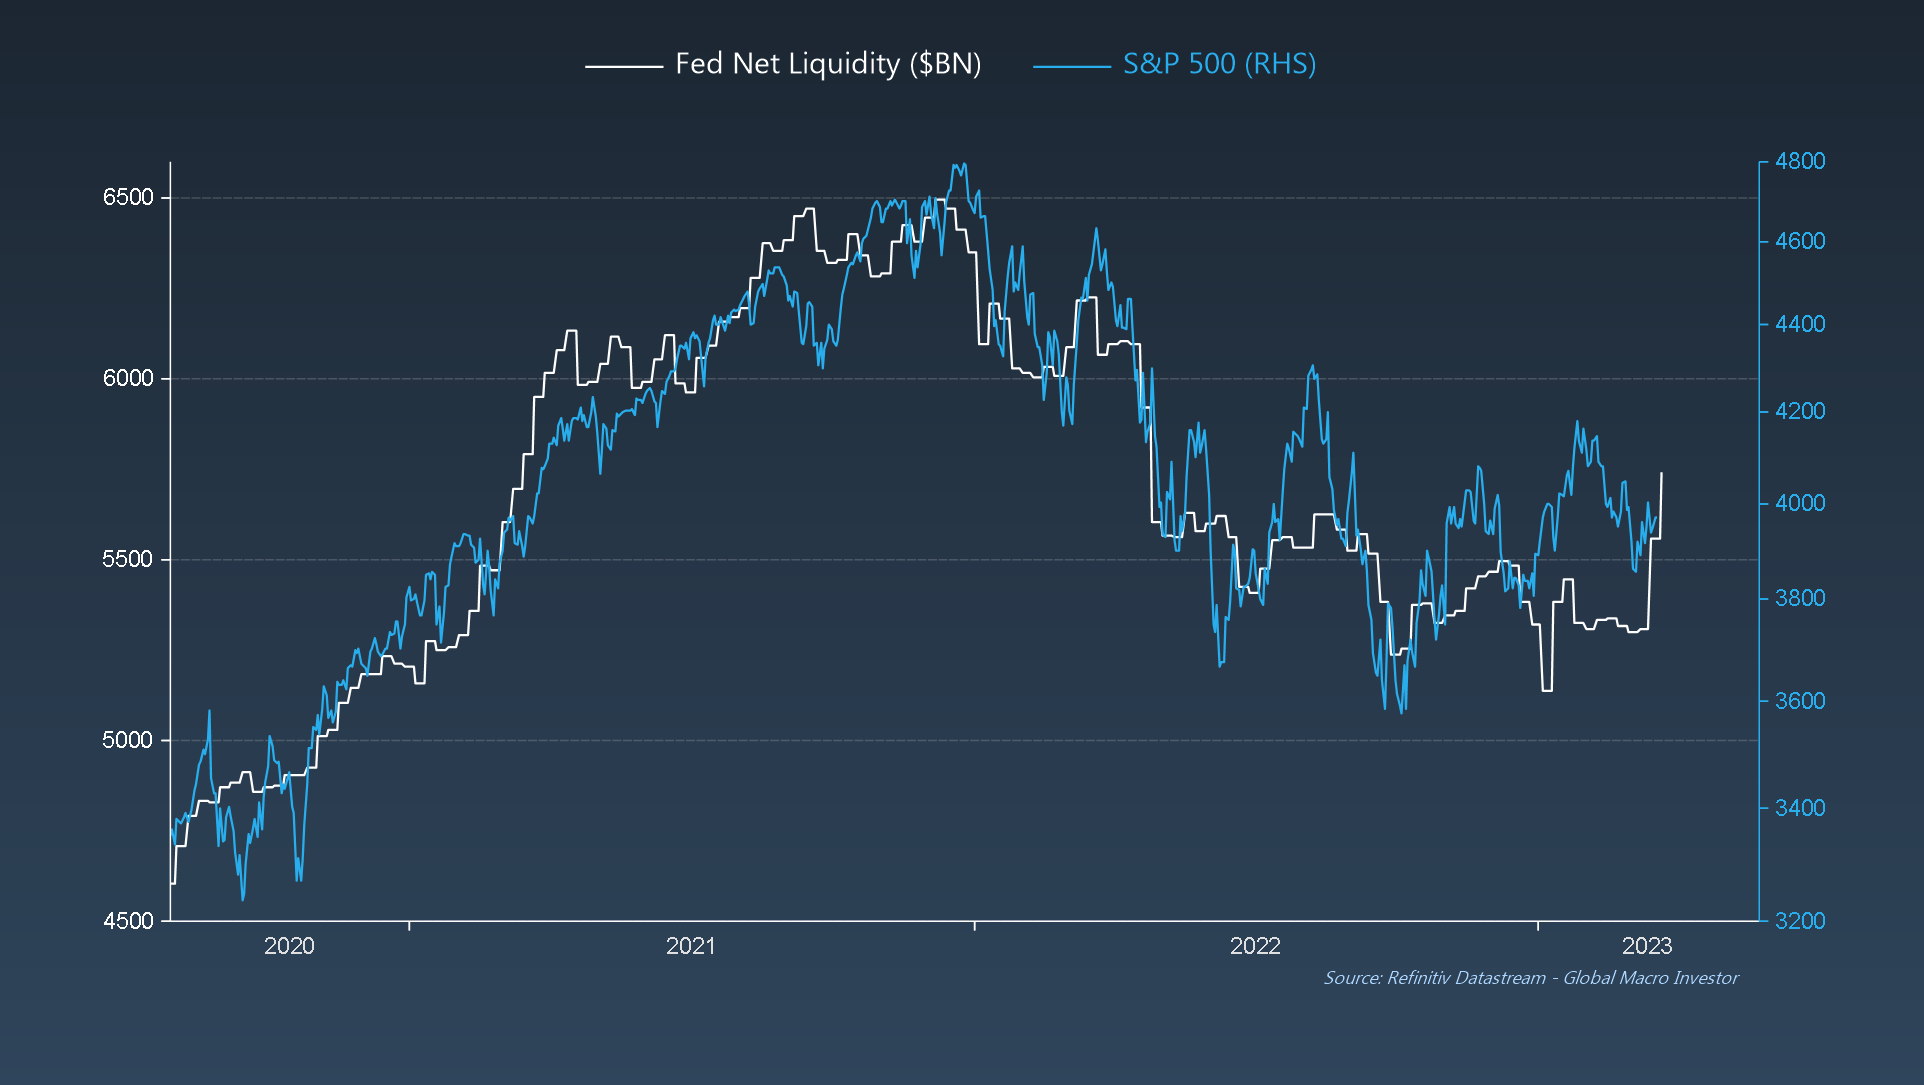
GMI Chart 1 – Fed Net Liquidity vs. S&P 500
Another week, another EXPLOSION in Fed liquidity as we have been expecting. We have now erased eleven months of QT in less than two weeks with a $434 billion dollar injection. Boom!
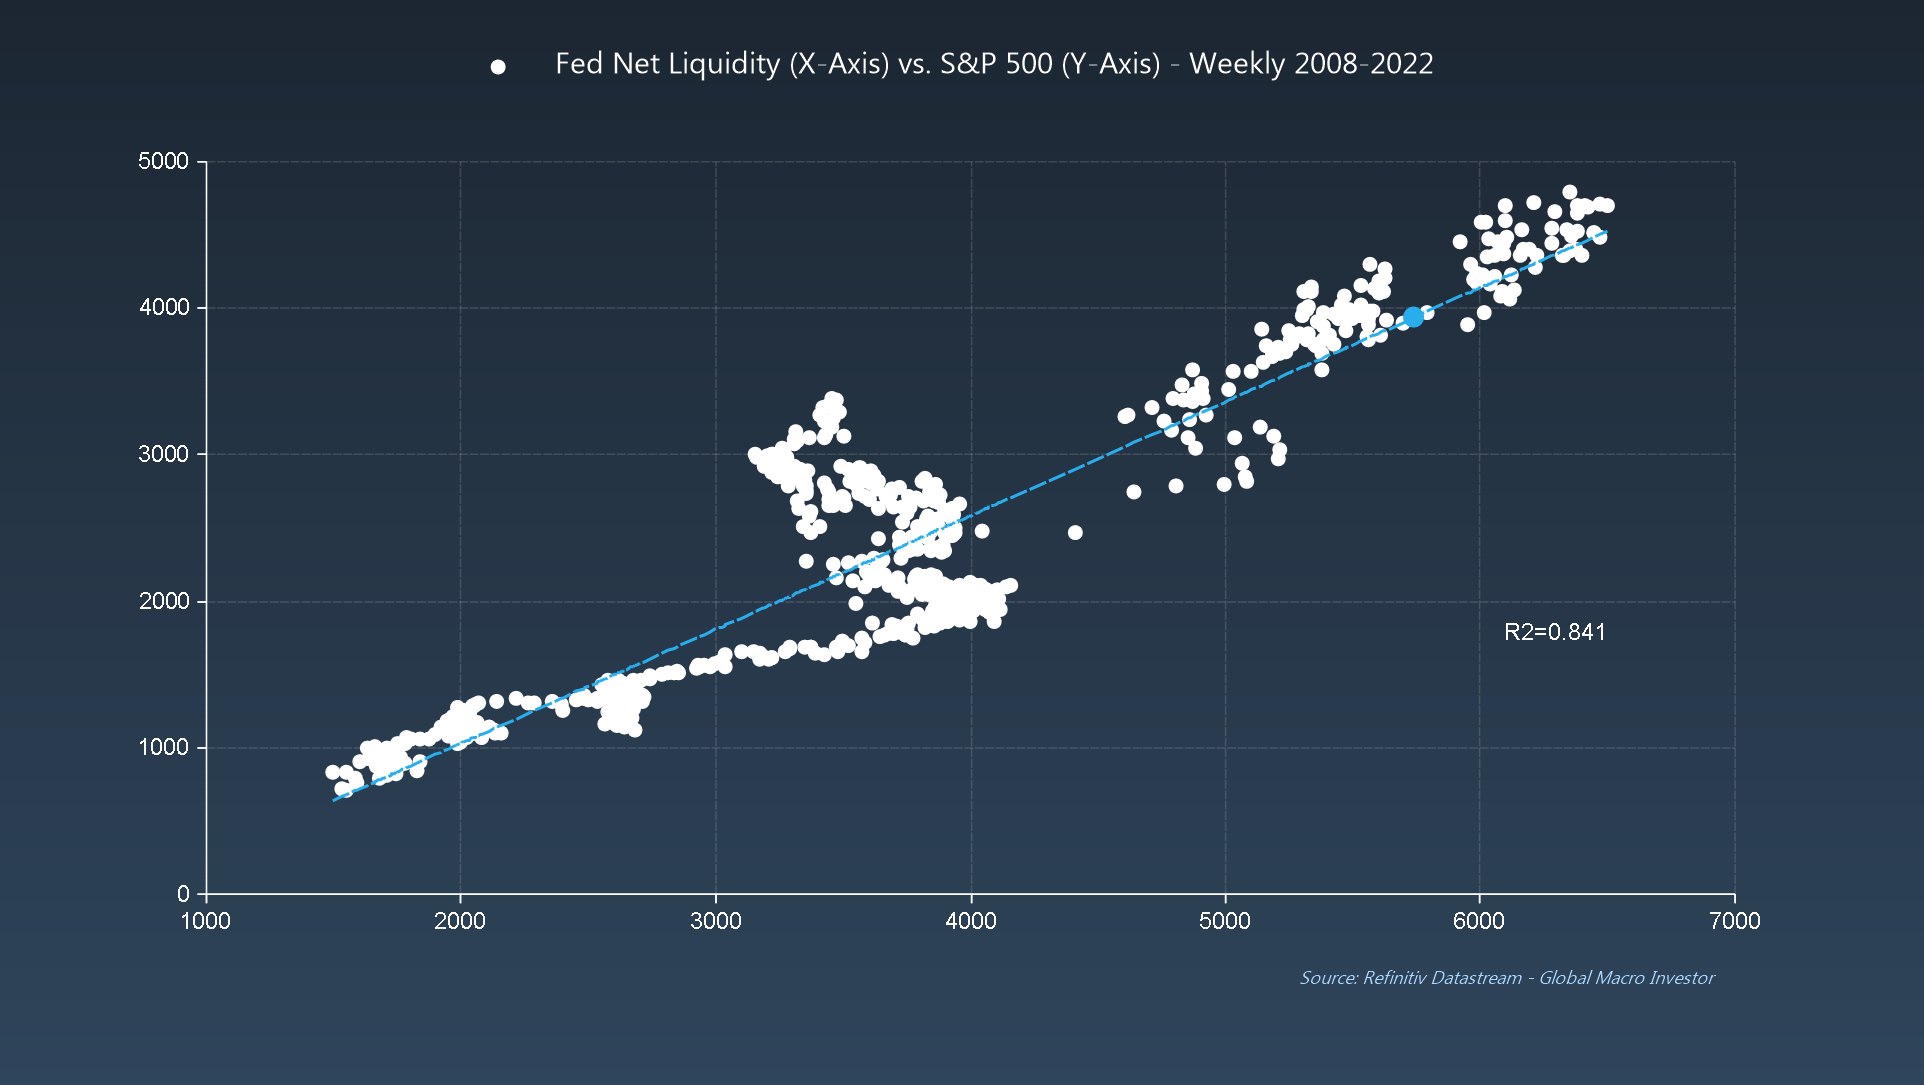
GMI Chart 2: Fed Net Liquidity vs. S&P 500 (Scatter Chart)
The surge in liquidity also means that the S&P 500 is back to trading bang on fair value versus domestic liquidity implied fair value conditions; liquidity is the only thing that matters for risk assets right now.
GMI Chart 3: S&P 500 with % of Stocks Above the 50-Day Moving Average
Additionally, the S&P 500 is also back to being oversold on a number of metrics:
- 1. The % of stocks trading above the 50-day moving average fell below the 20% threshold this week:
- 2. The 25-Day Toraku Ratio is also back in oversold territory after signaling overbought back at the beginning of February – currently the most oversold since October of last year.
- 3. The % of stocks trading with a 14-day RSI less than 30 rose to 27% last week, which triggered right on key support for the S&P 500. We think it holds. Let’s see:
GMI Chart 4: CFTC S&P 500 Net Speculative Positioning as a % of Total OI vs. S&P 500 YoY%
Also, speculators remain very short the S&P 500 at -4% of total open interest.
GMI Chart 5: CFTC Aggregate Net Speculative Positioning in US Treasuries
... and it’s the same when we look at bonds – still near record short. Fuel for the fire!
The GMI Big Picture
We continue to hold the view that CPI is going to melt over the coming three to six months. Regional Fed Supplier Delivery Times continued to collapse in March and currently have CPI closer to 0%.
Also, don’t forget what we’ve been saying for some time: big spikes in inflation tend to be reflexive (symmetrical in rise and fall) due to the base effect: elevator up = elevator down!
Additionally, our GMI Financial Conditions Index continues to skyrocket higher on the back of recent dollar weakness, plunging commodity prices and lower bond yields, which will be a tailwind for the ISM in a couple of months.
... with our GMI ISM Momentum Index currently suggesting that the ISM could be up as much as 2.7 points year-on-year by September, targeting an ISM of around 54...
In the meantime, the record short in Treasuries coupled with a near-record dislocation of bonds with the business cycle, needs to close. Bond yields are heading MUCH lower from here.
The last chart we’ll leave with you to mull over is below. Remember, liquidity is the tide that lifts all ships and, as we’ve been saying now since September 2022 when we wrote our September GMI Monthly titled “The Turn is Near”, more cowbell (liquidity) is coming. MOAR!
Next week, as we are writing the April GMI Monthly, we will not release a weekly update but, as ever, we will share something special with you from one of our recent GMI Monthly publications. Stay tuned!
***
Want to read these the moment they come out? Sign up entirely free for my newsletter, Short Excerpts From Global Macro Investor here. New articles published every single Sunday.
Trading in financial instruments and/or cryptocurrencies involves high risks including the risk of losing some, or all, of your investment amount, and may not be suitable for all investors. Prices of cryptocurrencies are extremely volatile and may be affected by external factors such as financial, regulatory or political events. Trading on margin increases the financial risks.
Before deciding to trade in financial instrument or cryptocurrencies you should be fully informed of the risks and costs associated with trading the financial markets, carefully consider your investment objectives, level of experience, and risk appetite, and seek professional advice where needed.
Fusion Media would like to remind you that the data contained in this website is not necessarily real-time nor accurate. The data and prices on the website are not necessarily provided by any market or exchange, but may be provided by market makers, and so prices may not be accurate and may differ from the actual price at any given market, meaning prices are indicative and not appropriate for trading purposes. Fusion Media and any provider of the data contained in this website will not accept liability for any loss or damage as a result of your trading, or your reliance on the information contained within this website.
It is prohibited to use, store, reproduce, display, modify, transmit or distribute the data contained in this website without the explicit prior written permission of Fusion Media and/or the data provider. All intellectual property rights are reserved by the providers and/or the exchange providing the data contained in this website.
Fusion Media may be compensated by the advertisers that appear on the website, based on your interaction with the advertisements or advertisers.