Fears that the Chinese coronavirus may impact economic growth have dealt a strong blow to an already oversupplied oil market.
Yesterday’s 3.77% drop was the worst since the 4.93% plunge of Jan. 2, which followed comments by U.S.President Donald Trump suggesting a potential broader Mideast conflict. Investor fears that a widespread military confrontation would slow economic growth were sufficiently potent to offset the boost to crude prices that any disruption of the Middle East oil flow would normally spark.
What we found interesting is that while equities first rallied on Chinese steps to rein in the virus, the commodity never rose. Does this mean oil traders are not as gullible as their equity counterparts?
WTI has been falling on the prospect of tensions with Iran denting economic growth, even though such discord would also interrupt production and thus tighten supply. That slide is continuing now as so-called black gold is sold off on concerns the spread of the virus could stall a global economic recovery, turning the current oversupply in the market into a glut of epic proportions.
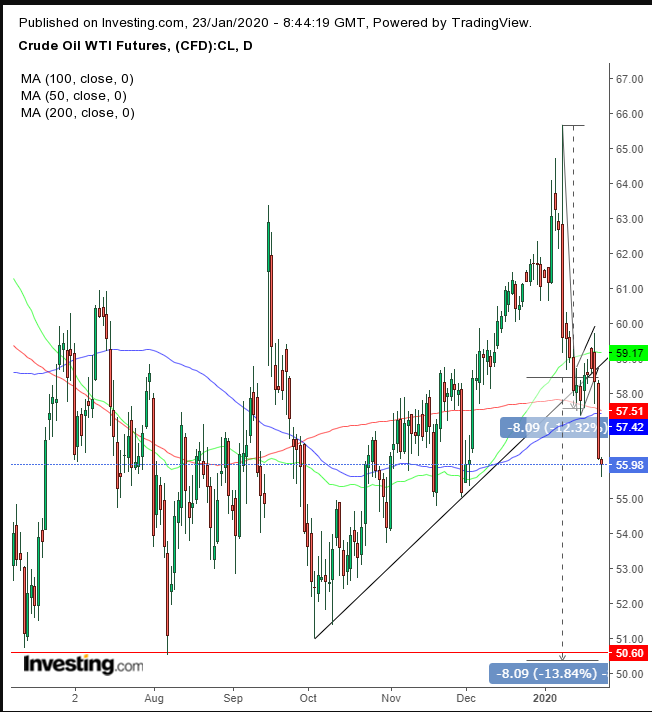
The technical charts are also presenting clear, bearish signals that are easy to recognize.

The price of oil has fallen below its uptrend line since the start of October, with a completed rising flag — extremely bearish after the five straight day loss — forming the flagpole. The two technical events occurring together, the drop below the uptrend line and the rising flag, compound the bearish signal. A third simultaneous technical trigger is the 200 DMA.
The fact that it’s situated right below the flag further reinforces the thesis that the price below $60 a barrel is a major technical pressure-point, where both bears and bulls go all in.
The implied target of the sharp move before the flag, driven by traders who are invested in this market, is above $50, which also happens to be the next psychological round number. If that line succumbs, it will break a major support since June, putting the December 2018 bottom of $42 on the table.
Trading Strategies
Conservative traders should wait for a likely return move to retest the flag’s integrity, with at least one long, red candle falling away from the pattern, before committing to a short position.
Moderate traders are likely to wait for that pullback for an entry closer to a resistance, not necessarily for proof of the continuation pattern’s resistance.
Aggressive traders may enter a contrarian, long position, counting on a return move which occurs in about two-thirds of flag breakouts. We can already see signs of a rebound, with an intraday bullish hammer. Then, they’d join the market with the presumed downfall that will follow.
Contrarian Trade Sample
