Mexico's peso is strengthening for the sixth straight day, on the promise of a signed, trilateral trade agreement between the United States, Canada and Mexico. This would replace NAFTA, the North American Free Trade Agreement, which came into effect in 1994.
This so-called New NAFTA was held up for two years as Democrats insisted the deal include stronger labor protections. However, they are now reportedly nearing agreement, clearing the way for a vote in Congress this month.
As a result, the outlook for Mexico’s economy, which is heavily reliant on trade with the U.S., has improved. This, in turn, has boosted the country's currency. But will it continue to strengthen? That depends on what happens in Congress.
According to Forbes, a final deal could be approved within 24 hours, but some key Democrats still appear to be stalling the process. Nevertheless, efforts continue. According to House Speaker Nancy Pelosi, “you don’t have to have unanimity, you just have to have consensus.”

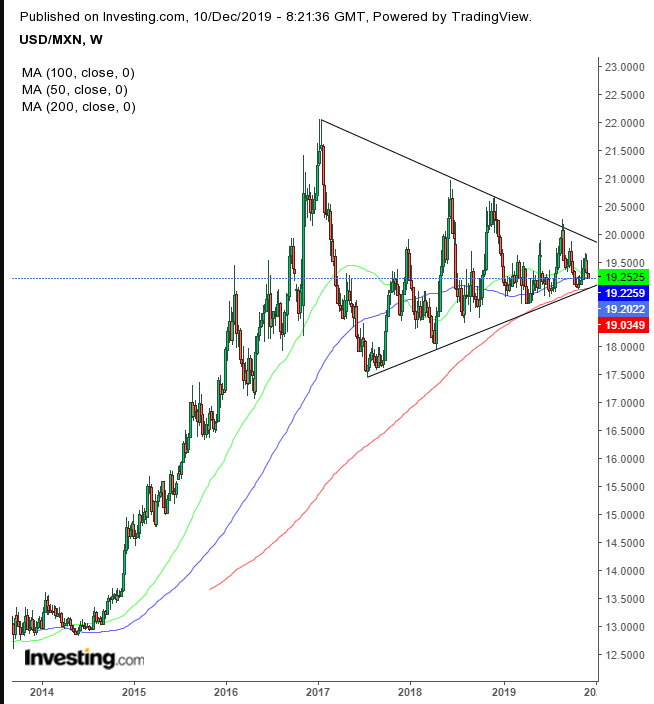
Technically, the USD/MXN has been trapped within a triangular range since January 2017. The pair is approximately 0.8% from the bottom of this massive pattern, at the current angle. Adding to the significance of the “red line” between the bulls and bears is the 200 WMA, at the triangle bottom.
The pair already gapped down below the 200 DMA on Monday, retested it, and closed below it. Today, it extended the drop. However, the 200 WMA is a much bigger deal, for two reasons:
- Falling below a price average of the last 4 years has greater significance than falling below the average price of the last year.
- Crossing below the 200 DMA for this asset in this market dynamic is not very significant considering how the price has been ranging, crossing over and below the MA a dozen times with each rise and fall.
In stark contrast, the last time the pair as much as touched the 200 WMA was in mid-2013.
The Mexican peso’s decline since Donald Trump attacked Mexico during his Presidential bid in 2015 can be clearly seen in the chart. So, a finalized agreement and the economic benefits that would bring would also pave the way for a peso comeback, with the most important fundamental and technical milestones in sync.
Trading Strategies
Conservative traders should wait for a clear resolution to the triangular congestion, with a return move that demonstrates obvious resistance, before risking a short position.
Moderate traders are likely to also wait for a downside breakout, followed by a pullback, but in this case for a better entry, not necessarily for proof of reversal.
Aggressive traders might enter a short position on a profit-taking or negative-news-related pullback, with a stop loss above the 200 DMA, above 19.3000, while turning defensive as the price nears the pattern bottom.
Trade Sample
